Gene Expression Tools
The following is a stand-alone version of an electronic Fluorescent Pictograph Browser to facilitate the visualization of gene expression data.
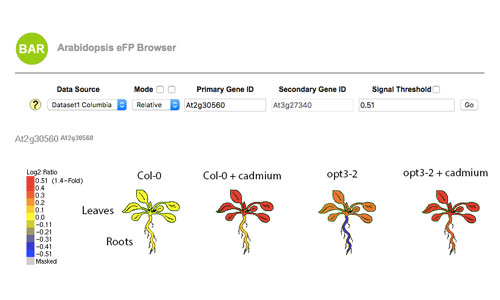
For these experiments, Arabidopsis plants (Col-0 and opt3-2) were grown hydroponically and exposed – or not – to 20 microM CdCl2 for 72 hrs. Roots and shoots were then harvested and processed for RNA extraction and Illumina sequencing (Khan et al., 2018 Plant Cell and Environ. doi: 10.1111/pce.13192.).
This eFP browser can be used to compare gene expression among tissues (roots and shoots), genotypes (Col and opt3-2) and treatment (Cd and no Cd added) in two different modes: Absolute and Relative. In Absolute mode, the scale and colors is based on the absolute FPKM values of the selected gene, while in Relative mode the scale represents the FPKM ratio of the gene of interest compared to the FPKM value of the same gene in Col-0 without any treatment (i.e. sample/control).